- Crypto Is Easy
- Posts
- The Easy Plan for Buying and Selling Bitcoin
The Easy Plan for Buying and Selling Bitcoin
How to ride the wave up and avoid the crash. Bookmark this page.

Bitcoin’s price goes up and down like crazy. How do you know whether an upswing marks the top of the market? When we get a downswing, how do you know whether it’s a dip or the start of a cycle-ending crash?
Nobody knows, but if you have the right data, you can get a pretty good idea.
Fortunately, smart people have gathered lots of data on Bitcoin. More specifically, how Bitcoin acts in different circumstances.
Thanks to the transparency of Bitcoin’s blockchain, we can see changes in HODLing behaviors, money entering and leaving exchanges, gains and losses among Bitcoin wallets, and lots of other information about long-term price movements.
We can use that data to get a good idea of what to expect in certain situations. With that data, I designed an easy plan to navigate long-term tops and bottoms with a fair amount of confidence.
The goal is to build wealth with crypto without a lot of effort, stress, or trying to time the market.
While the price action can get quite extreme—up 50% or more after seeing signs of a peak, down 50% or more after seeing signs of a bottom—this is an extreme market. You have to give some margin for error. Close enough is good enough.
More on that below.
I’ve used this plan to guide my decisions for years. However, I’ve deviated many times, for reasons I explained to premium subscribers at the time.
No plan can do everything for everybody all the time. Take your circumstances into account when you follow it.
Backtesting the Plan
With this plan, you outperform dollar cost averaging. On average, you get 30% more Bitcoin for your investment.
That may sound lackluster, but you won’t find many plans that do better without more risk, stress, expense, or volatility.
With this plan, you sold above $133 in early 2013, above $760 in late 2013, and above $16,000 in late 2017. Pretty good for missing the peak by more than 25% each time!
You would not have sold in 2021, but you would not have bought most of the time. For the entirety of that year, your average price would have been about $37,000, assuming you bought the same amount each day that Bitcoin’s price was in my buying zone.
Most finished down for the year. You finished up 13% with cash to spare—and did even better if you followed my plan before 2021.
Dollar-cost averaging would have given you an average price of $47,000. Following my plan, you got 30% more Bitcoin for the same amount of money.
Without deviations, your decisions looked like this:

This chart approximates the price/time of buy/sell decisions to fit the space and format.
When you include trades and deviations along the way since 2020, you would've done this:

This chart approximates the price/time of buy/sell decisions to fit the space and format.
What this plan can and can’t do
This plan limits your downside financial risks and simplifies your decisions. It uses dollar-cost averaging as its benchmark.
With this plan, you catch all the major bottoms without buying higher than necessary. Along the way, you will have opportunities to sell profitably, but the goal is to give you staying power and boost your returns. Selling is the contingency, not the goal.
Don’t trade based on this plan! If all goes well, you’ll never sell.
What about the movements between those tops and bottoms?
On the premium plan, you’ll have my market updates and commentary to help you navigate the ebbs and flows. I’ll send alerts to premium subscribers.
Breaking Down the Plan
Below, I have simplified the plan into “When to Buy” and “When to Sell.”
When to Buy
First, let me disclaim:
There is never a bad time to buy Bitcoin. Stack sats freely, regardless of price. There’s no need to stress about it. If you get the urge to buy, DO IT.
This plan waits for dips. Not those 10-15% drops we see all the time. Real dips, those 30-60% crashes that freak everybody out.
What’s a dip?
Whenever the blue line to goes below between the black lines on this chart, which you can see with a free account from TradingView:
On that chart, the blue line represents Bitcoin’s price. The black lines represent an extrapolation of the Mayer Multiple, a metric that identifies the low-risk entries for Bitcoin.
(You need to create a free TradingView account to see the lines.)
With this plan, you buy some Bitcoin whenever the blue line is between the black lines.
As an option, you can buy up to the orange line on that chart, which the average price for the previous 130 days.
Historically, you get good risk/reward entries below that orange line, though you’ll want to consider the market circumstances and your overall financial situation before you decide how much to buy.
As the price moves, those black and orange lines will move, too. As a result, the buying price will rise and fall over time.
I will send a “buy” alert when it’s time to buy Bitcoin.
Please open the chart and scroll back in time so you can see how the plan works and what to expect.
NOTE—if Bitcoin’s price goes below the bottom black line on that chart, we’ll have to figure out why before we make any decisions. This happens rarely and never lasts long.
When to Sell
While you may need to sell as market and personal conditions change, the plan says to sell Bitcoin after two of three things happen:
Puell Multiple hits the 3 level on this chart:

Bitcoin’s Bollinger BandWidth hits its trendline on this chart:

Bitcoin goes into the Danger Zone.

Puell Multiple
The Puell Multiple compares the price of newly-mined Bitcoin to the market value of all Bitcoins at a given time. When the Puell Multiple goes way up, miners tend to dump on the market. When it goes way down, they tend to hoard.
Miners’ behaviors often mimic HODLer behaviors. They also have a disproportionate impact on the market because they're the only forced sellers in crypto.
Extreme readings suggest everybody’s looking to sell and nobody plans to HODL. Meanwhile, new buyers tend to have weak hands or only want to flip their Bitcoins for profit. As a result, the market crashes (it does not dip).
Take a look at this chart, with meaningful peaks circled:
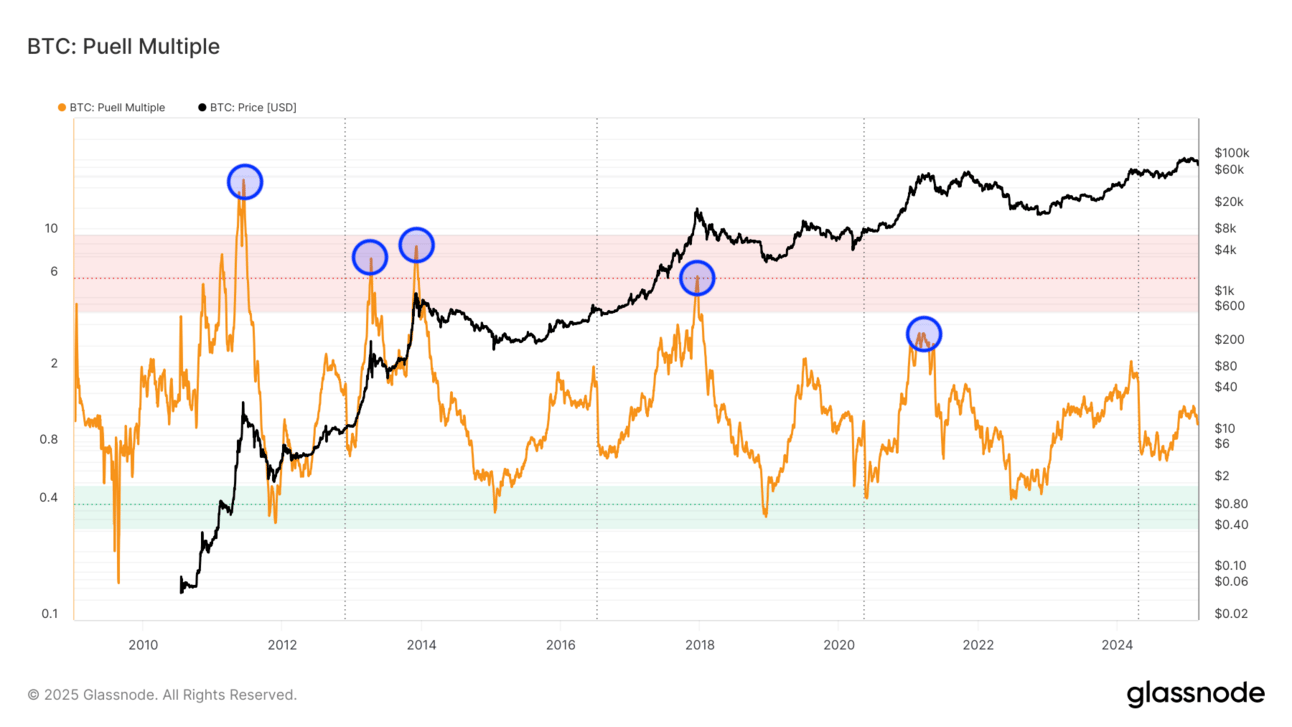
Bitcoin’s price is black. The Puell Multiple is orange.
Notice that the Puell Multiple peaks lower with each market cycle. This suggests caution at even lower levels, below 3.
The problem is, one metric can always fail. As such, we have the other two, as well.
Bollinger BandWidth
BBW measures how high and fast Bitcoin’s price moves relative to recent benchmarks. In this case, roughly 20 months.

As Bitcoin's price accelerates, people get more excited and scared. They sell more quickly, without enough time for new buyers to fill in the gaps.
BBW expresses this indirectly. We can use it as a proxy for the psychology behind these actions.
We need to take notice once the indicator gets near the dashed back trendline.
Danger Zone
My Danger Zone imputes several metrics that reflect the changes in behaviors among people in the market.

On its own, this won't tell you whether to sell. In some cases, Bitcoin’s price can go 50-100% higher after reaching the danger zone simply from momentum and enthusiasm.
However, pairing this metric with the other metrics can give you a clearer picture.
How I will sell
I’ll have a more detailed exit plan when the time’s right. In a nutshell, here are the steps:
Sell half immediately and unstake altcoins that have “unlocking” or “cooling-off” periods.
Sell half of the rest every 5 days until Bitcoin’s price goes back into my buying zone.
For altcoins, I'll keep you posted in my market updates. While the plan does not apply to altcoins, if we're selling Bitcoin, it's likely a good time to sell everything else. I have some key levels for altcoins and treat each token as its own investment, so we can't plan too far in advance.
Prices will probably go up after we sell. That’s the point. We need people to buy from us on the way up.
As a bonus, we know our bad timing will work in our favor. When we miss, our next chance will bring us more money.
If you wait until after the peak and sell on the way down, your misses bring back less cash.
What if the signals don’t trigger?
All the better. Selling is the contingency, not the goal.
Along the way, you can sell to prepare for future crashes, respond to market circumstances, or balance personal financial needs. I’ll let you know when I do this.
Why do I use a plan?
If this data seems obvious, keep in mind that when we get to the peak, it will be impossible to tell whether we’re in the middle of a normal 30-50% dip or one of those devastating 80-90% crashes.
As such, I stick to the metrics until there’s some reason to doubt the results.
Does that mean I might never sell?
Yes. In fact, I would prefer to never see those signals. Since we buy only after the market drops, we never get too exposed. Our portfolios will go up and down like crazy. We’ll get in with far less downside and far more upside.
(Never let me stop you from selling anything for money, whether that’s crypto or anything else.)
Why do I buy in chunks, not all at once?
When I buy the dips, I buy in small amounts over time.
While I lose a bit if prices move up quickly, that doesn’t happen often enough to risk a big chunk of money if the market turns against me. Sometimes, a 30% drop goes down another 30%. We buy after the 30% drop but expose ourselves to another 30% on the way down. By spreading out those buys over time, we get a chance to capture any further downside.
If the market goes up before we get our money in, we can save it for another time.
Why do I sell in chunks, not all at once?
These signals do not predict Bitcoin’s price. They signal extremes in sentiment and investor behavior. In fact, after these signals flash, Bitcoin’s price can go up quite a bit.
To make sure I catch some of those upswings, I will sell in chunks—more as the price goes up until I have confirmation that the crash has started.
Another benefit: if those signals prove false and Bitcoin’s price keeps going up for months, I can capture all that upside.
I'll keep you posted in my BUY/SELL/HODL alerts.
What do I do after the market peaks?
For Bitcoin, I’ll average back into the market when its price goes into the buying zone.
For altcoins, I’ll take stock of each project on its own merits and reassess it before reallocating to my favorite projects. I do this in all market conditions.

Reply