- Crypto Is Easy
- Posts
- Danger Zone Chart
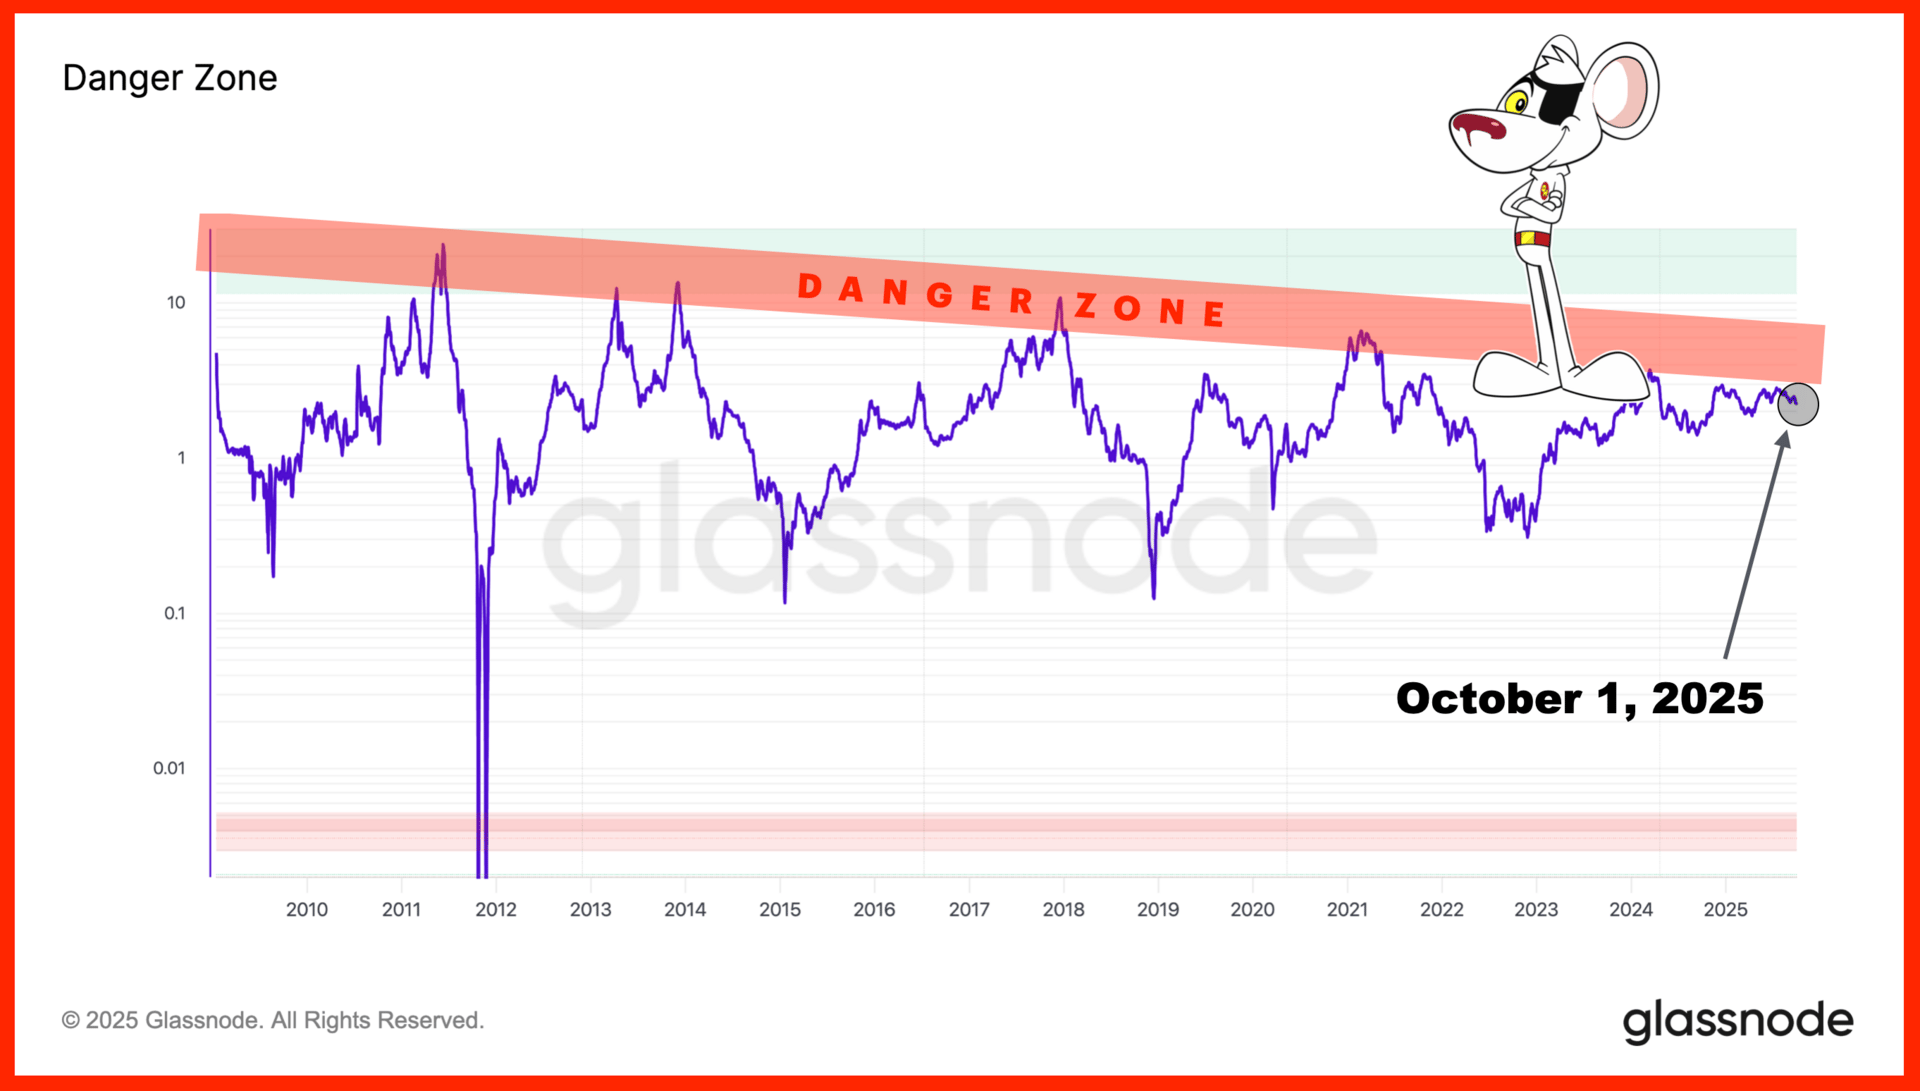
Danger Zone Chart
Time to start selling?
Along with my plan and the information you get from my market updates, I have a chart to tell us when the market has reached the conditions that led to major, cyclical peaks.
Once that chart reaches the Danger Zone, you should not put any money into the market. Don’t even try to catch an altcoin pump or swipe some fast cash on a momentum trade.
Instead, recognize you’re at the end of a major cyclical upswing—the brief moment of euphoria before a big, long-lasting crash or a bear market.
You can still get big drops without touching the Danger Zone. As such, you can’t form any conclusions or decisions simply from this metric. It’s just a quick, visual way to compare the maximum upside and downside at any time.
When the chart reaches the danger zone, it is the worst time to try to make money. You get little upside and lots of downside. On this chart, lower is better.
Here's the chart, updated regularly to reflect changes in market conditions. Bookmark this page and check back regularly! I will update the chart often as market conditions change all the time.
Mark, the zone slopes downward. Does that mean the crypto market cap will fall over time?
No. This chart has nothing to do with the market cap.
The chart imputes several metrics related to behavior and price. The danger zone trends downward because Bitcoin's price has traded in a narrower range as its market cap has grown. As a result, the metric becomes less extreme with each year.
This shows up as a downward-sloping danger zone.
Mark, shouldn't we use this instead of your plan’s sell signals?
The market can stay in the danger zone for months. During that time, Bitcoin’s price may go up 50% or more. Altcoins can do 5-10x.
You're playing with fire if you try to chase those outcomes, but you don’t need to sell.
Generally speaking, with Bitcoin, it's better to miss the peak and buy more when the price comes down than try to time the peak and miss. The market will bail you out.
(Altcoins are a different story. None of them are worth what you're paying now—not even the ones on my altcoin reports—but some will get so big that they will far exceed your expectations.)
Mark, can the cycle reach its peak without reaching the danger zone?
Yes, but that depends on how you define “cycle.”
Bitcoin’s price can drop 25-50% in all conditions, inside and outside the danger zone, for months. You can't escape volatility. This can feel like the end of a cycle, as it did in early 2020 and early 2021, without marking the true end.
To some extent, cycles are arbitrary. You can choose where they start or end based on whatever criteria you like. Some say cycles don’t exist anymore, simply long, sustained uptrends and long, sustained downtrends.

Think about the Danger Zone as a way to sense how much higher the market can go before its final destination. Are you getting compensated for suffering that volatility?
Also, this chart does not take the “macro” into account. Nor does it factor in external events like a Tether collapse, geopolitical issues, etc. These things can derail an uptrend for months, if not longer, regardless of this or any other chart.
Mark, should I use the Danger Zone to trade the market?
Maybe, but that's not its intent. I don't use it that way.
I stick to my portfolio strategy and plan for buying and selling.
For me, the Danger Zone is a barometer or speed gauge. I can use the information to make better decisions and stay out of harm’s way.
Individual indicators fail often and blended metrics like heatwaves and CBBI suffer statistical drift and may include irrelevant data.
The Danger Zone is more contextual. It accounts for behaviors that show up on-chain, more like the Fear/Greed Index or CAPE Ratio than a trading indicator.
Reply