- Crypto Is Easy
- Posts
- Market Update - July 31, 2025
Market Update - July 31, 2025
Crypto market update for July 31, 2025

Last chance to get the Easy Plan for Buying and Selling Bitcoin, Bull Market Exit Plan, and Top 10 of the Top 100 Altcoins as a premium bundle before the launch deal ends!
July’s about to close. What will August bring?
The metrics haven’t changed much since my last update, but we do see some new opportunities and interesting developments.
Topics for today’s update:
TL;DR
A bit of technical analysis
Back to the behavioral models
Watch out for the US dollar
A new play on MicroStrategy
Altcoins
Note, I do not have a video to go along with this update.
TL;DR
If you’re following the easy plan, you will buy when Bitcoin’s price goes below $74,000, with the option to start buying at $102,000. You’re constantly setting aside fresh cash for that opportunity.

If you haven’t sold any crypto, it’s not too late.
You may not need to, anyway. It’s more important to make sure you’re prepared for what comes after the hype dies down, especially if that happens sooner than people expect, or if the market peaks at a lower price than you expect.
If you took the long position from the July 3, 2025 update, play it tight in case we get that 2021 scenario or revert to our previous path, one that matches most closely with 2014.
We’re buying dot.com investments in 2000, playing for whatever is left of the tail end of a multi-year, parabolic bull run. It’s a race to see whether legacy entities can buy faster than smart money can sell. Treat every new all-time high as potentially the last.
If you don’t know what I’m talking about, catch up on recent updates. Start with last week’s update and work your way backward.
In a nutshell
More signs of exhaustion of the overall trend, suggesting we need some outside force to push the market higher.
The drop in STRK offers a new way to make money from Bitcoin and Strategy฿.
A bit of technical analysis
On the weekly trading chart, we can see a potential triple bearish divergence with a potential cross down on the stochastic RSI while the relative strength index (RSI) struggling to break above its two-year trendline.
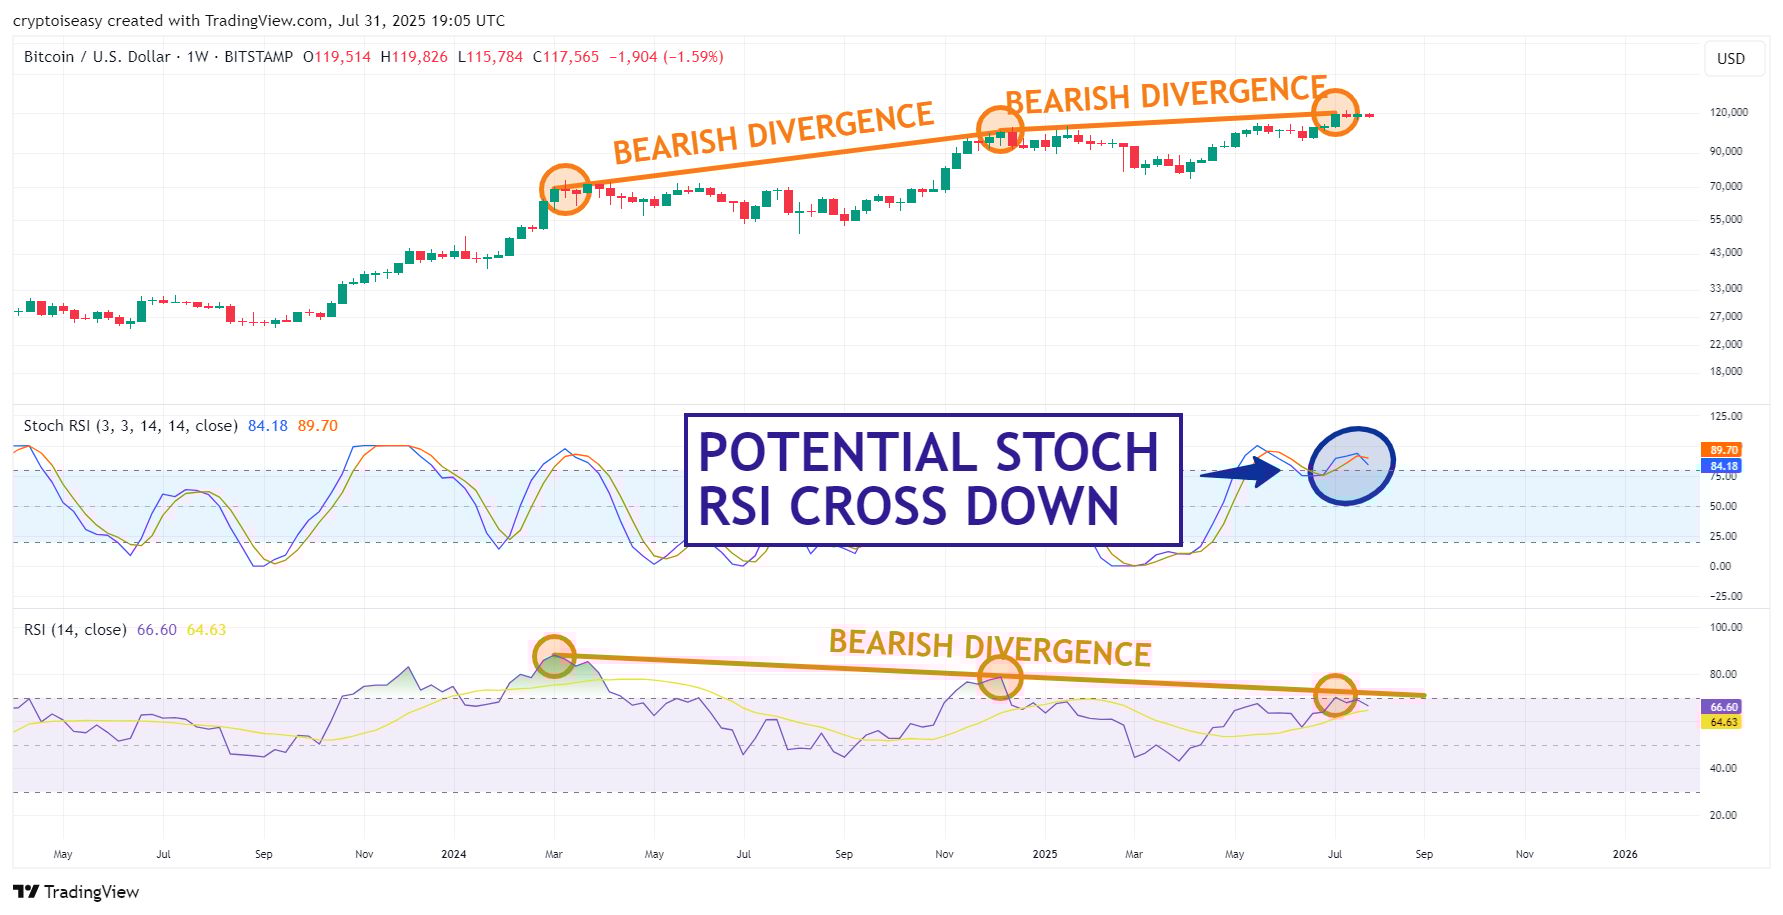
If these conditions don’t change before Sunday night, when the trading week closes, the chart will suggest momentum isn’t as strong as Bitcoin’s price makes it seem.
On the 3-day chart, we already have a cross down on the RSI with mild bearish divergence and a drop in M2 projected 2.5 months forward.

It’s a little too soon to read anything into the drop in M2, one measure of financial liquidity. When you look closely, you’ll see the metric started to diverge from price weeks ago, but that’s ok—this correlation comes and goes.
That said, if you believe M2 predicts Bitcoin’s moves two or three months in advance, I’d pay attention.
We know the fate of crypto in 2025 is all about the macro, not the on-chain or technical indicators. Bitcoin's Bull Market Runs Until Paolo and Saylor Say So.
As such, we have to accept that outside forces can bring enough buying pressure to make you rich enough to retire your bloodline.
They’ll have to.
When we combine those technical signals with the on-chain patterns we’ve seen in recent months, we can see that those outside forces are the only thing that can keep the market going higher. Insiders are cashing out or laying low.
Back to the behavioral models
Behavioral models suggest the we’re playing out the string.
You can’t see this in the daily or weekly movements of price. Let’s take a step back and look at the bigger picture.
Elliott Wave Theory
In the Elliott Wave Theory of markets, prices move in 5 waves up and three waves down.
In this case, when you look at Bitcoin’s price on a monthly chart since November 2022, you see an “expanded flat” where the B “corrective” wave goes a little higher than the top of wave 5.

That’s a classic five-wave pattern, with an “A” corrective downwave and “B” rebound. More signs of the times.
You don’t see the daily or weekly changes in price because this chart looks at a very, very long timeframe.
True, this month’s closing price of $116k-ish falls slightly higher than textbook expanding flat, which should go only 5% higher than wave 5, not 9% higher. Still, we can’t dismiss the similarity in structure. This market is never that precise.
Anatomy of Bubble
You can also look at the classic Anatomy of a Bubble chart.

At the beginning of this year, many on-chain, behavioral, technical, and engagement indicators reached extreme levels as the public was showered with proclamations of “new paradigm” as Trump came into office. We saw the data in real time in previous updates.
Public attention and retail interest has fallen since then, though Bitcoin’s price has gone up (many altcoins remain the same price or lower).
That’s evidence that we’re in the “return to normal” stage of the bubble cycle after the psychological peak. See the chart above.
Some will argue we’re in the “institutional investors” phase—right before the mania phase that brings a parabolic explosion.
Institutional investors are certainly buying into Bitcoin treasury companies and ETFs, but both of those vehicle get a lot of inflows from retail speculators and individuals buying for their own benefits. We know many of those institutional investors bought in 2024, and some have admitted as such.
In previous updates, we’ve seen institutional inflows on a downtrend for most of the year, albeit from a very, very, very high level (still positive net). The rate of VC investment and new project launches fell off a cliff.
Legacy funds and Wall Street entities are certainly putting money into crypto, but a lot of money is also coming from Billy the Neighbor throwing some IRA funds into BITW.
Also, with the rise in the US stock market and persistently high US interest rates throwing off record amounts of cash for bondholders, Aunt Sally and Uncle Morton had to buy a little more of the Bitcoin ETFs to keep their 1-3% Bitcoin allocation target.
We see a strong secondary market and ample liquidity for whales to sell Bitcoin-related products to family offices, private funds, and individual investors. People say “wait until Wall Street enters,” but Wall Street’s already in.
We’ll cover the Wall Street Cheat Sheet next week.
Watch out for the US dollar
USD is way down for the year. It’s been beaten to shreds. Maybe now’s a good time to get some?
On the broad dollar index, we see a bullish cross up on the stochastic RSI and oversold conditions on the relative strength index.

(You see a similar structure on the more common DXY chart. I prefer the broad index because it captures more currencies than the DXY.)
When these indicators act like this, you often see a a bounce, perhaps even the start of a prolonged, multiyear rally.
Given the circumstances, it’s not a bad time to scoop up some cheap dollars, just in case USD starts pumping. This kind of opportunity doesn’t come often and usually doesn’t last very long.
Plus, you can get staking rewards from depositing your USD into a money market fund or staking USDC on Coinbase.
A new play on MicroStrategy
I’m still mostly in cash equivalents.
If you’re also in the same position, we have some flexibility to make a move that doesn’t depend on the market going up or down.
While everybody else targets MSTR, we can buy STRK, a perpetual preferred share of Strategy฿. The shares carry an $8 dividend with the option to convert to stock when MSTR hits $1,000.
Compare that to some other fixed-income alternatives:
Blended bond funds yield about 5% if you’re lucky.
Nook ranges from 7-10% on average. (Enter the referral code MARK after signup to get a 1% boost.)
Coinbase USDC fetches +4% annually, on par with money market funds.
At any price up to $108, STRK does as well or better than those alternatives, with the option to pick up MSTR at a massive premium to today’s price should the opportunity come.
As of this post, it’s trading at $109 but you can set a limit order below $108 or tell your broker to find a buyer at $108 or less.
Why does this move work?
We collect the dividends for as long as we want, as long as Strategy฿ stays in business. Saylor has acquired enough Bitcoin at low enough prices that we should not have to worry about that. If Strategy฿ gets into trouble, I find it highly unlikely Saylor will go into bankruptcy instead of selling some BTC.
In the event Strategy฿ goes into bankruptcy, STRK holders are second in line to get paid and will get $100 per share. We’d get paid before MSTR holders. Given the 6x asset cushion Strategy฿ has on top of its liabilities, a lot would have to go wrong for the company to renege on the $100/share redemption price.
We don’t have to worry about market volatility. STRK will pay $8 per share no matter what happens to the prices of MSTR, STRK, or BTC.
What’s the risk?
The moment Strategy฿ starts selling Bitcoin, its price will tank, forcing the market into a cascading death spiral. Each sale will push Bitcoin’s price down and make it harder for Strategy฿ to raise money, forcing the company to sell more Bitcoin, pushing prices lower, etc.
We don’t know how low it could go, nor the odds that Strategy฿ will go out of business as a result.
Further, some traders and funds have structured bets contingent on BTC’s and MSTR’s price, and potentially STRK’s price, too. Should those positions unravel too quickly, they’ll get blown out. Very ugly stuff.
In such a scenario, Strategy฿ might not have enough money to pay dividends or make good on the $100 redemption price. Everything may collapse.
(This scenario is hypothetical but realistic. Make sure you know what you’ll do if this happens.)
Altcoins
I still have not filled my sell orders for SWTH. Beyond that, I’m sticking with the altcoins I have left and waiting for blood in the streets.
Altcoins remain well above my three “blood in the streets” allocation zones, shown on this chart of the altcoin market minus ETH and the big stablecoins:
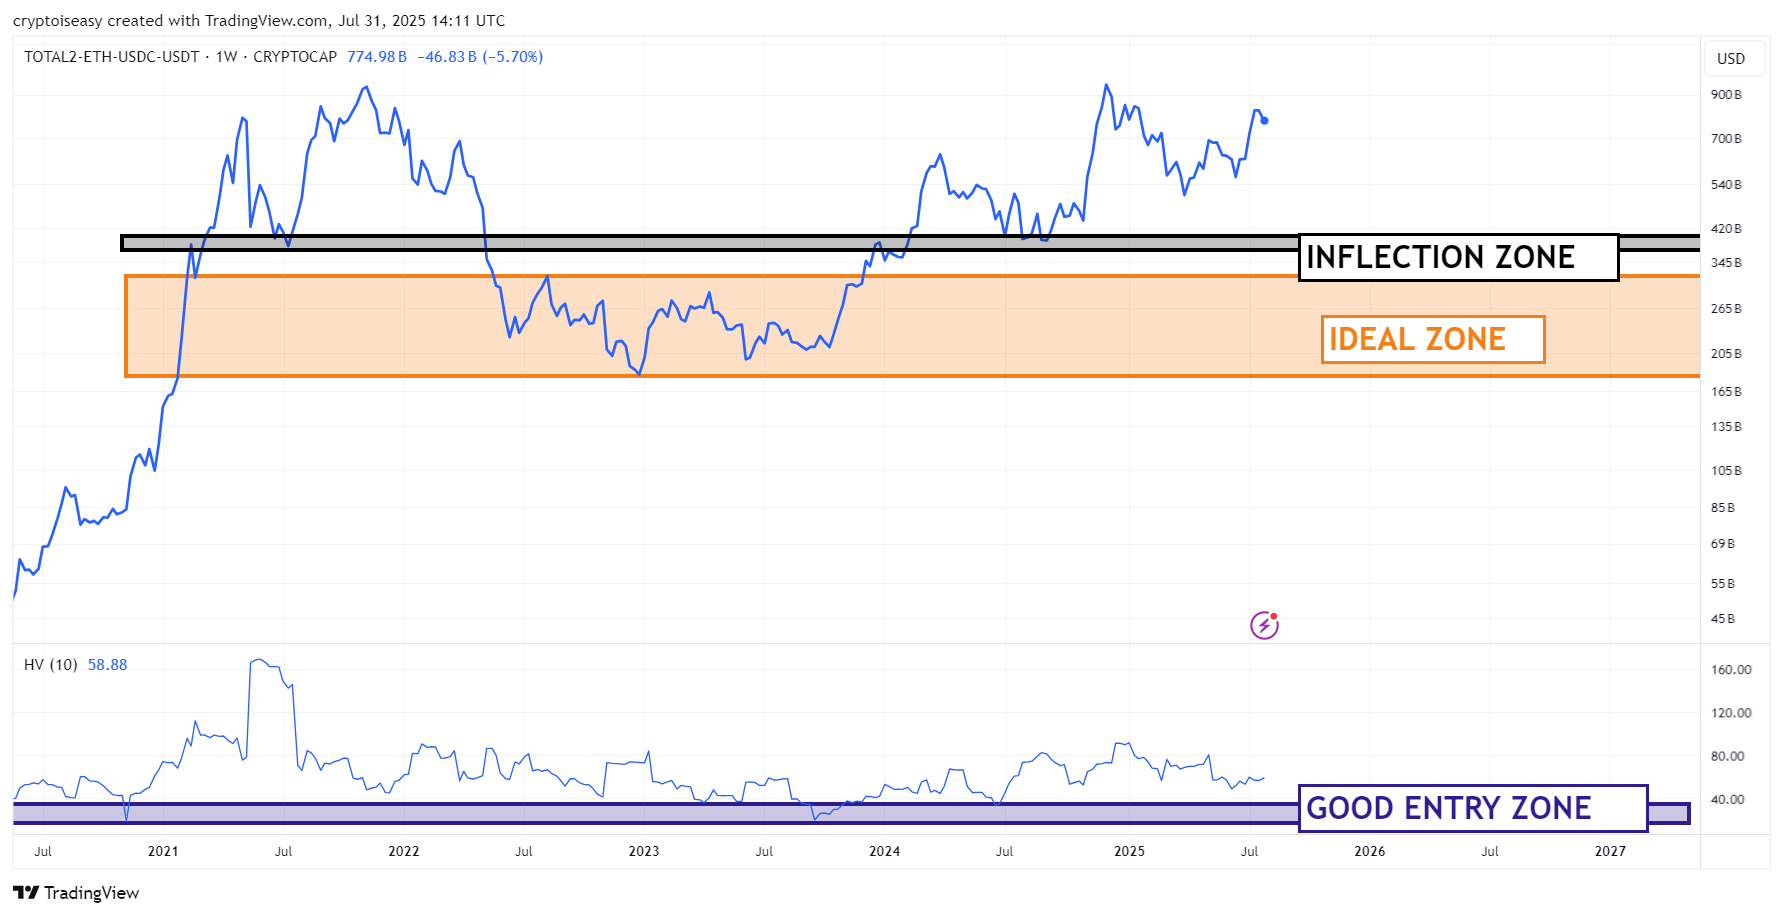
As such, no plans to expand my altcoin positions.
You can still put some money into altcoins for a rally. You might catch a pump.
Altcoins remain in the ideal zone relative to Bitcoin on my chart of altcoin dominance, which strips out ETH and the big stablecoins.
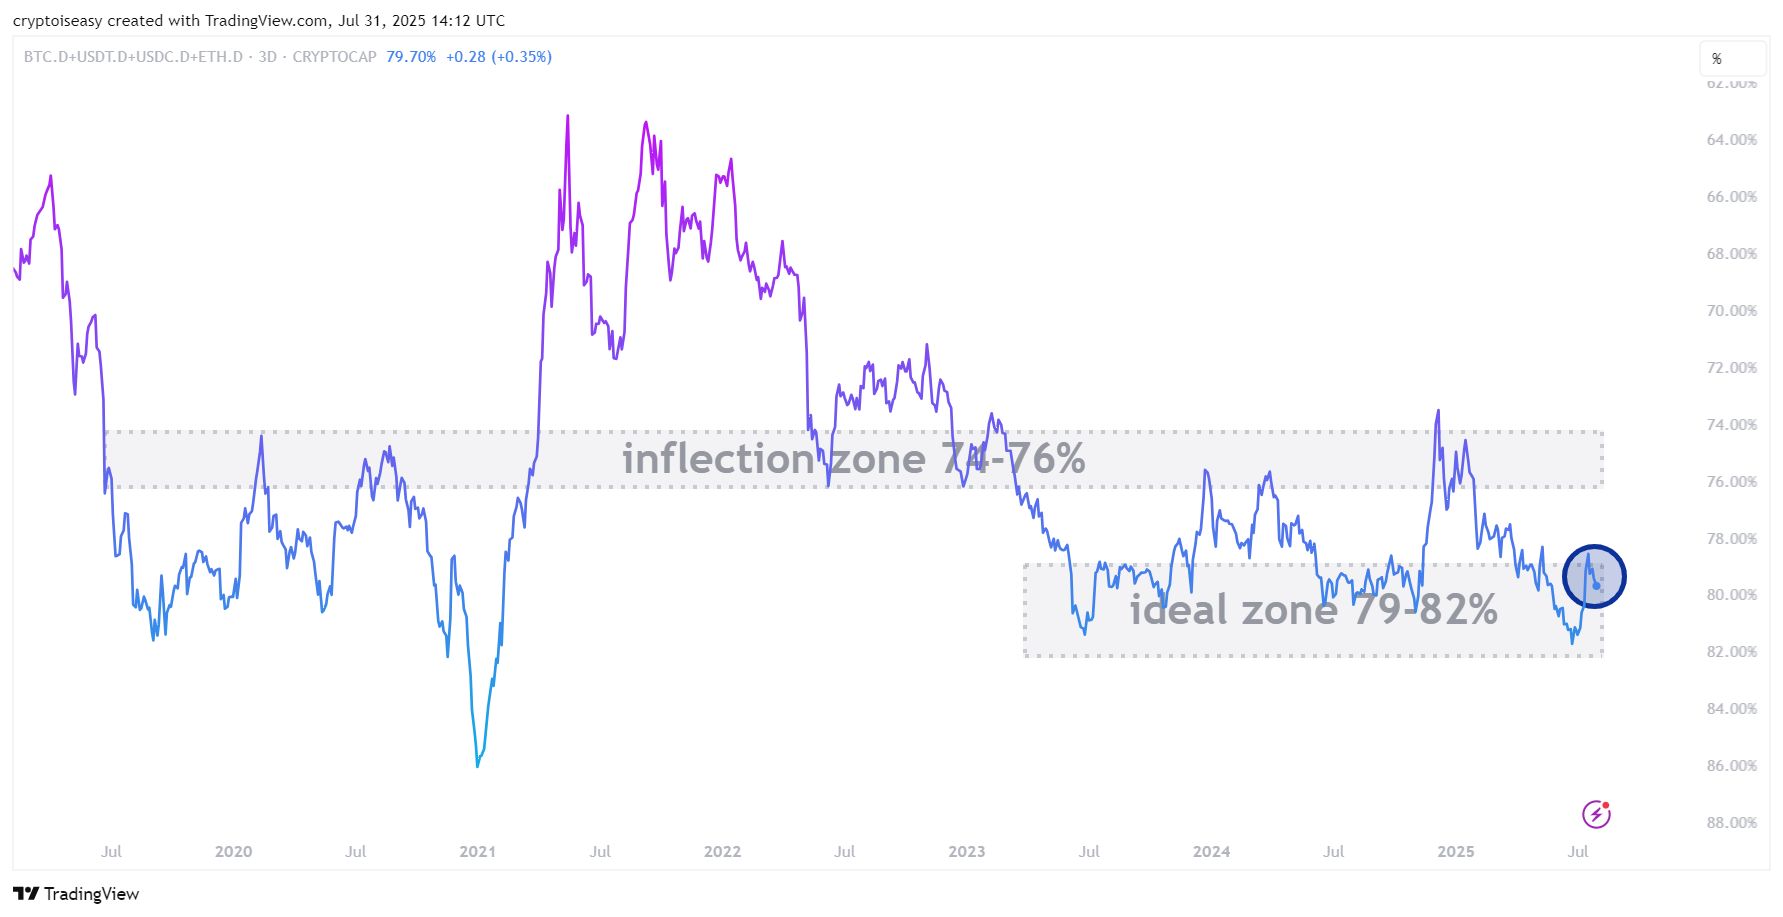
Altcoins will follow Bitcoin up and down but when they’re in the ideal zone, you’ll capture more upside when BTC goes up than you might lose when BTC goes down, on average.
As always, when BTC drops alts drop harder. It’s a relative advantage, not an absolute one.
Play it tight given the frothy nature of today’s market, especially on altcoins that have already pumped off their recent lows. Think “crypto casino,” not “retire your bloodline.” You can come back later at lower prices.
I’ll let you know when we get closer to the inflection zone.
An AI-written haiku based on this post:
Charts warn from the peaks.
Institutions or retail?
Chase the casino.
Relax and enjoy the ride!
Reply